Overview
Introducing the nquiringminds SBOM Analysis Platform, an essential resource for software developers and security experts seeking to get profound understanding of their software's constituent parts. Users may upload a Software Bill of Materials (SBOM) to get a comprehensive overview of every component's details, including version, licensing, and related vulnerabilities.
Understanding the importance of security, our platform highlights critical details, such as the severity score of vulnerabilities, common weakness enumerations, and the state of the memory protection system. The colour-coded severity breakdown makes it easy to prioritise actions based on the risk level—red for critical, orange for high, and so on—providing a clear and immediate visual cue of potential security issues.
For each component, the system lists the number of vulnerabilities and divides them into unprotected and protected memory systems, allowing for a dual perspective on security. With the added convenience of a direct link to the National Vulnerability Database (NVD) for more detailed information, our users have all the resources they need to make informed decisions about their software's security posture.
Key Features
SBOM Visualisation Page:
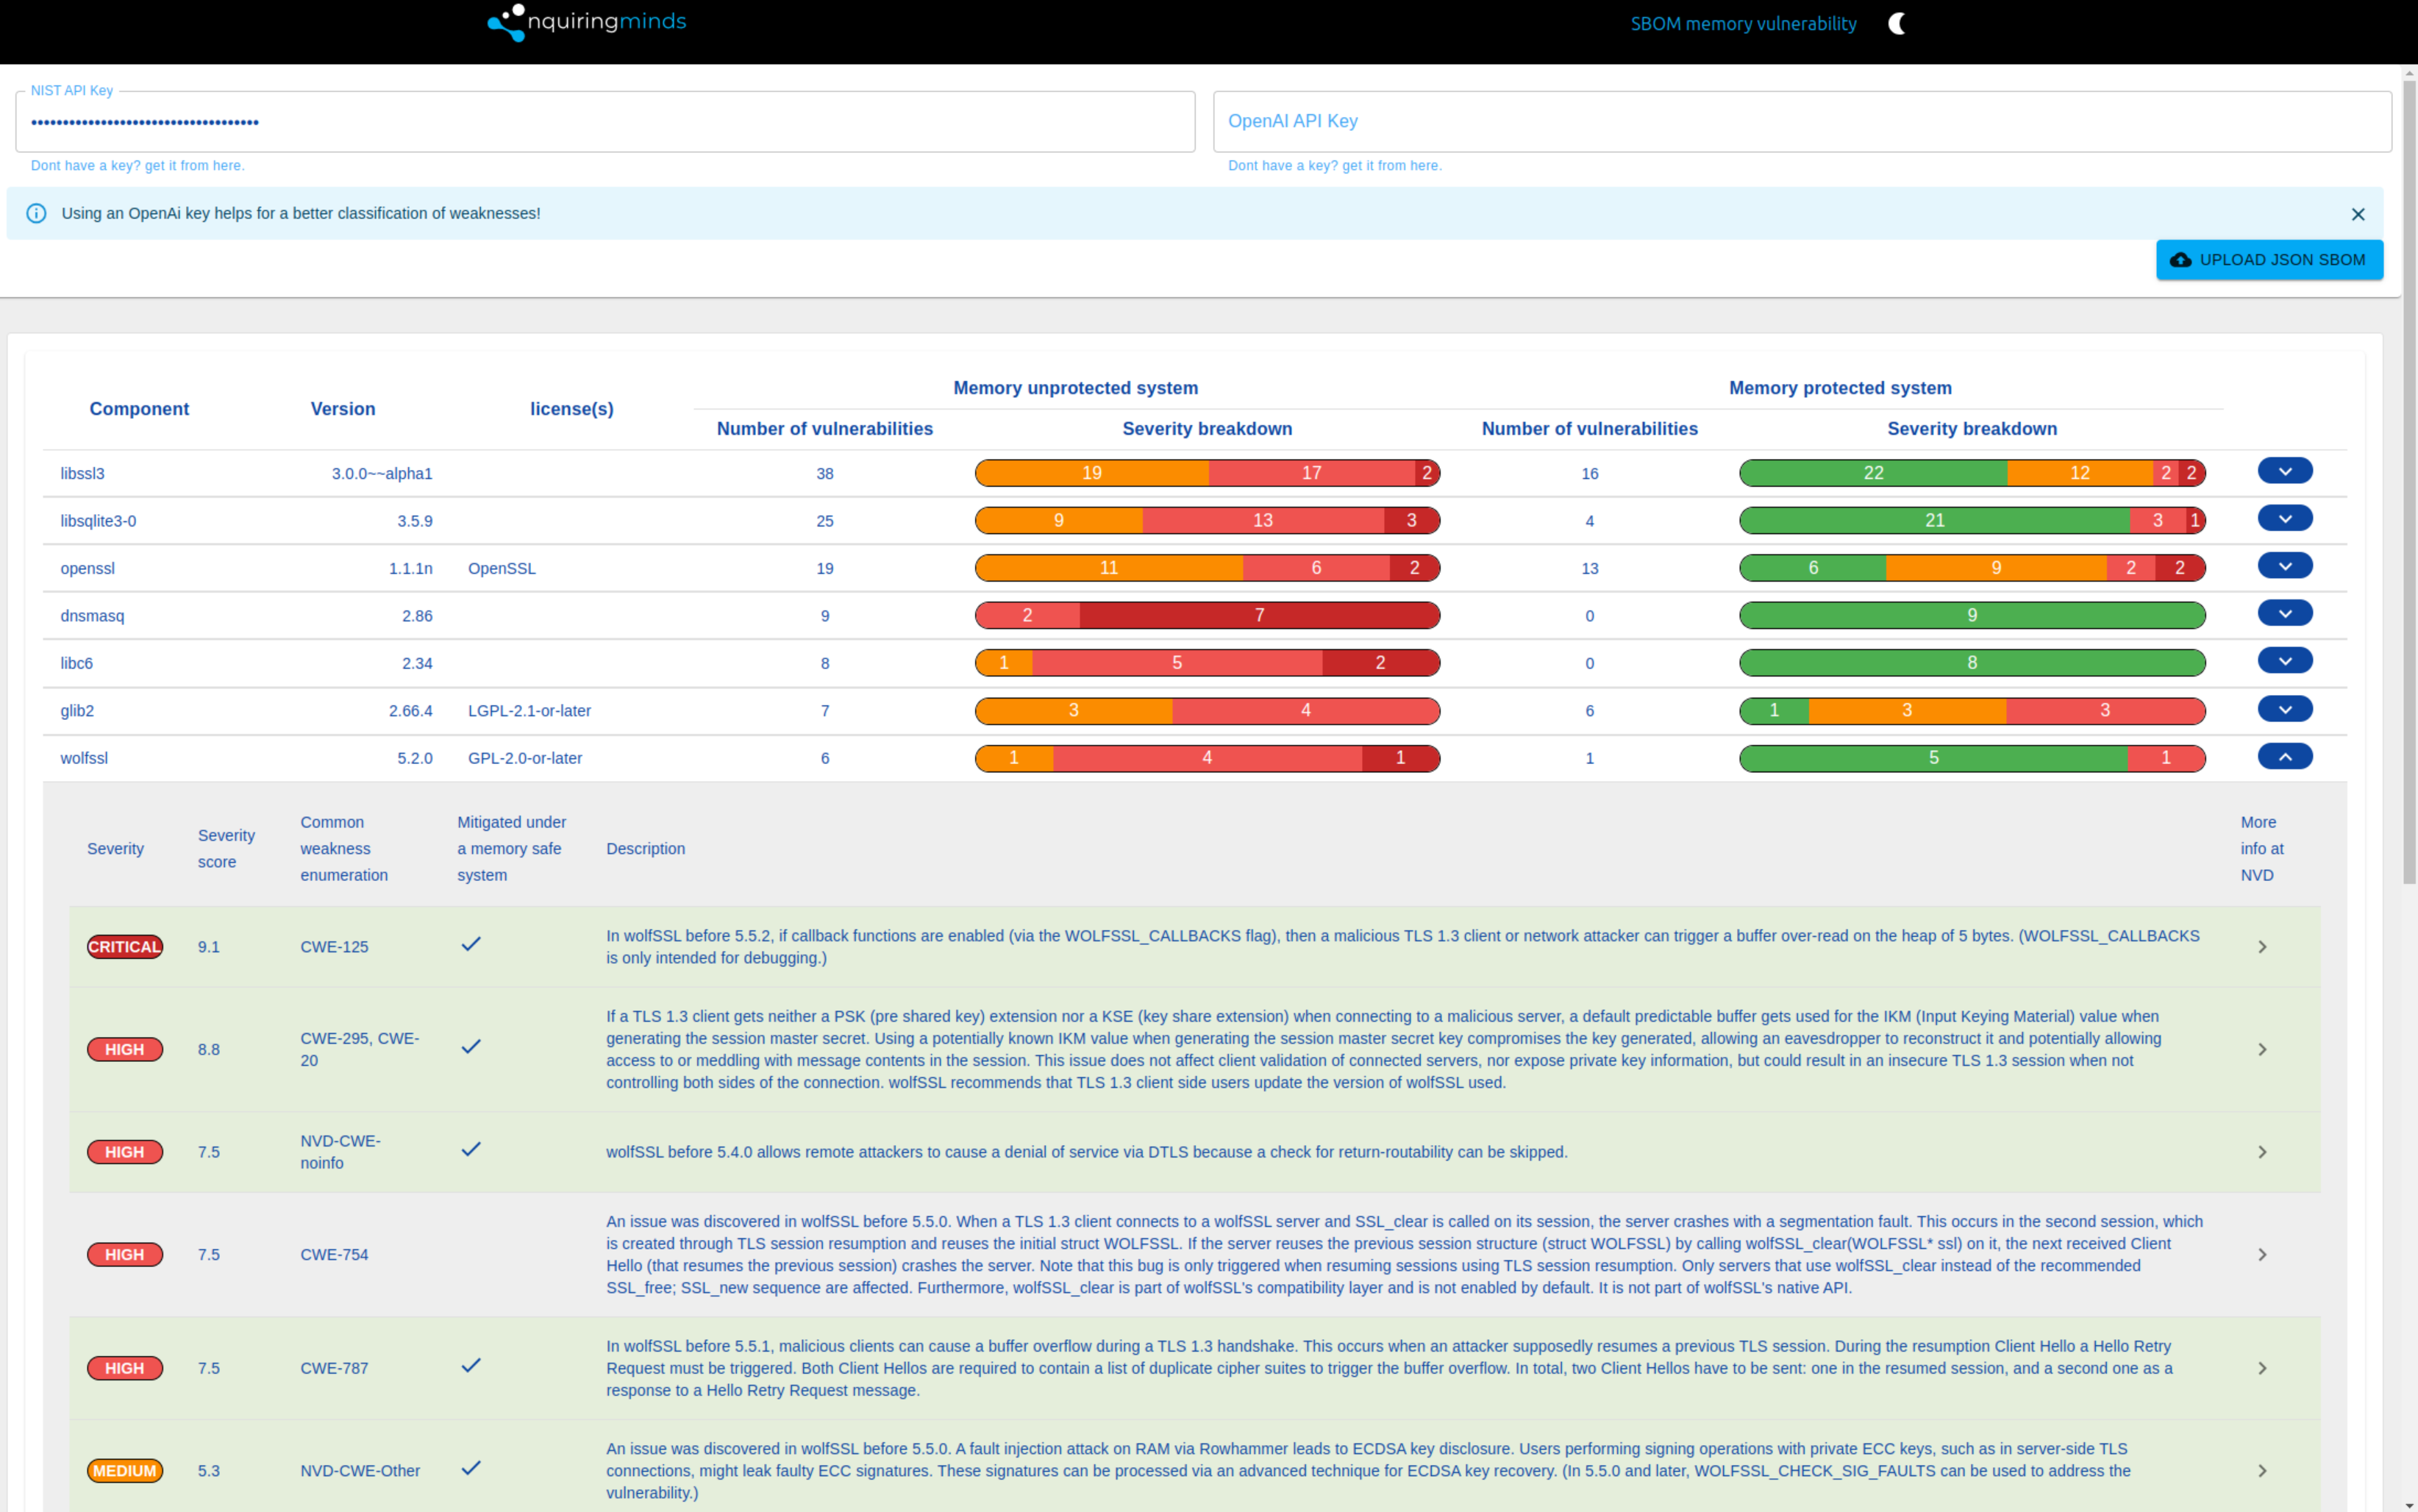
Comprehensive Component Analysis:
The SBOM Visualization page presents a detailed analysis of each software component within the uploaded SBOM. It lists out components along with their respective versions, licenses, and a comprehensive tally of known vulnerabilities.
Severity Assessment:
Each component's vulnerabilities are categorised based on their severity levels, providing a clear visual indicator through color-coded bars, helping users prioritise security efforts on critical vulnerabilities that could pose significant risks.
Memory Safety Insight:
The visualisation distinguishes between vulnerabilities that affect memory-protected systems and those that threaten memory-unprotected systems, enabling a deeper understanding of potential attack vectors.
Vulnerability Details:
A dropdown for each component reveals further details of the vulnerabilities, including a description and a direct link to the National Vulnerability Database (NVD) for extended information.
CPE History Visualisation Page:
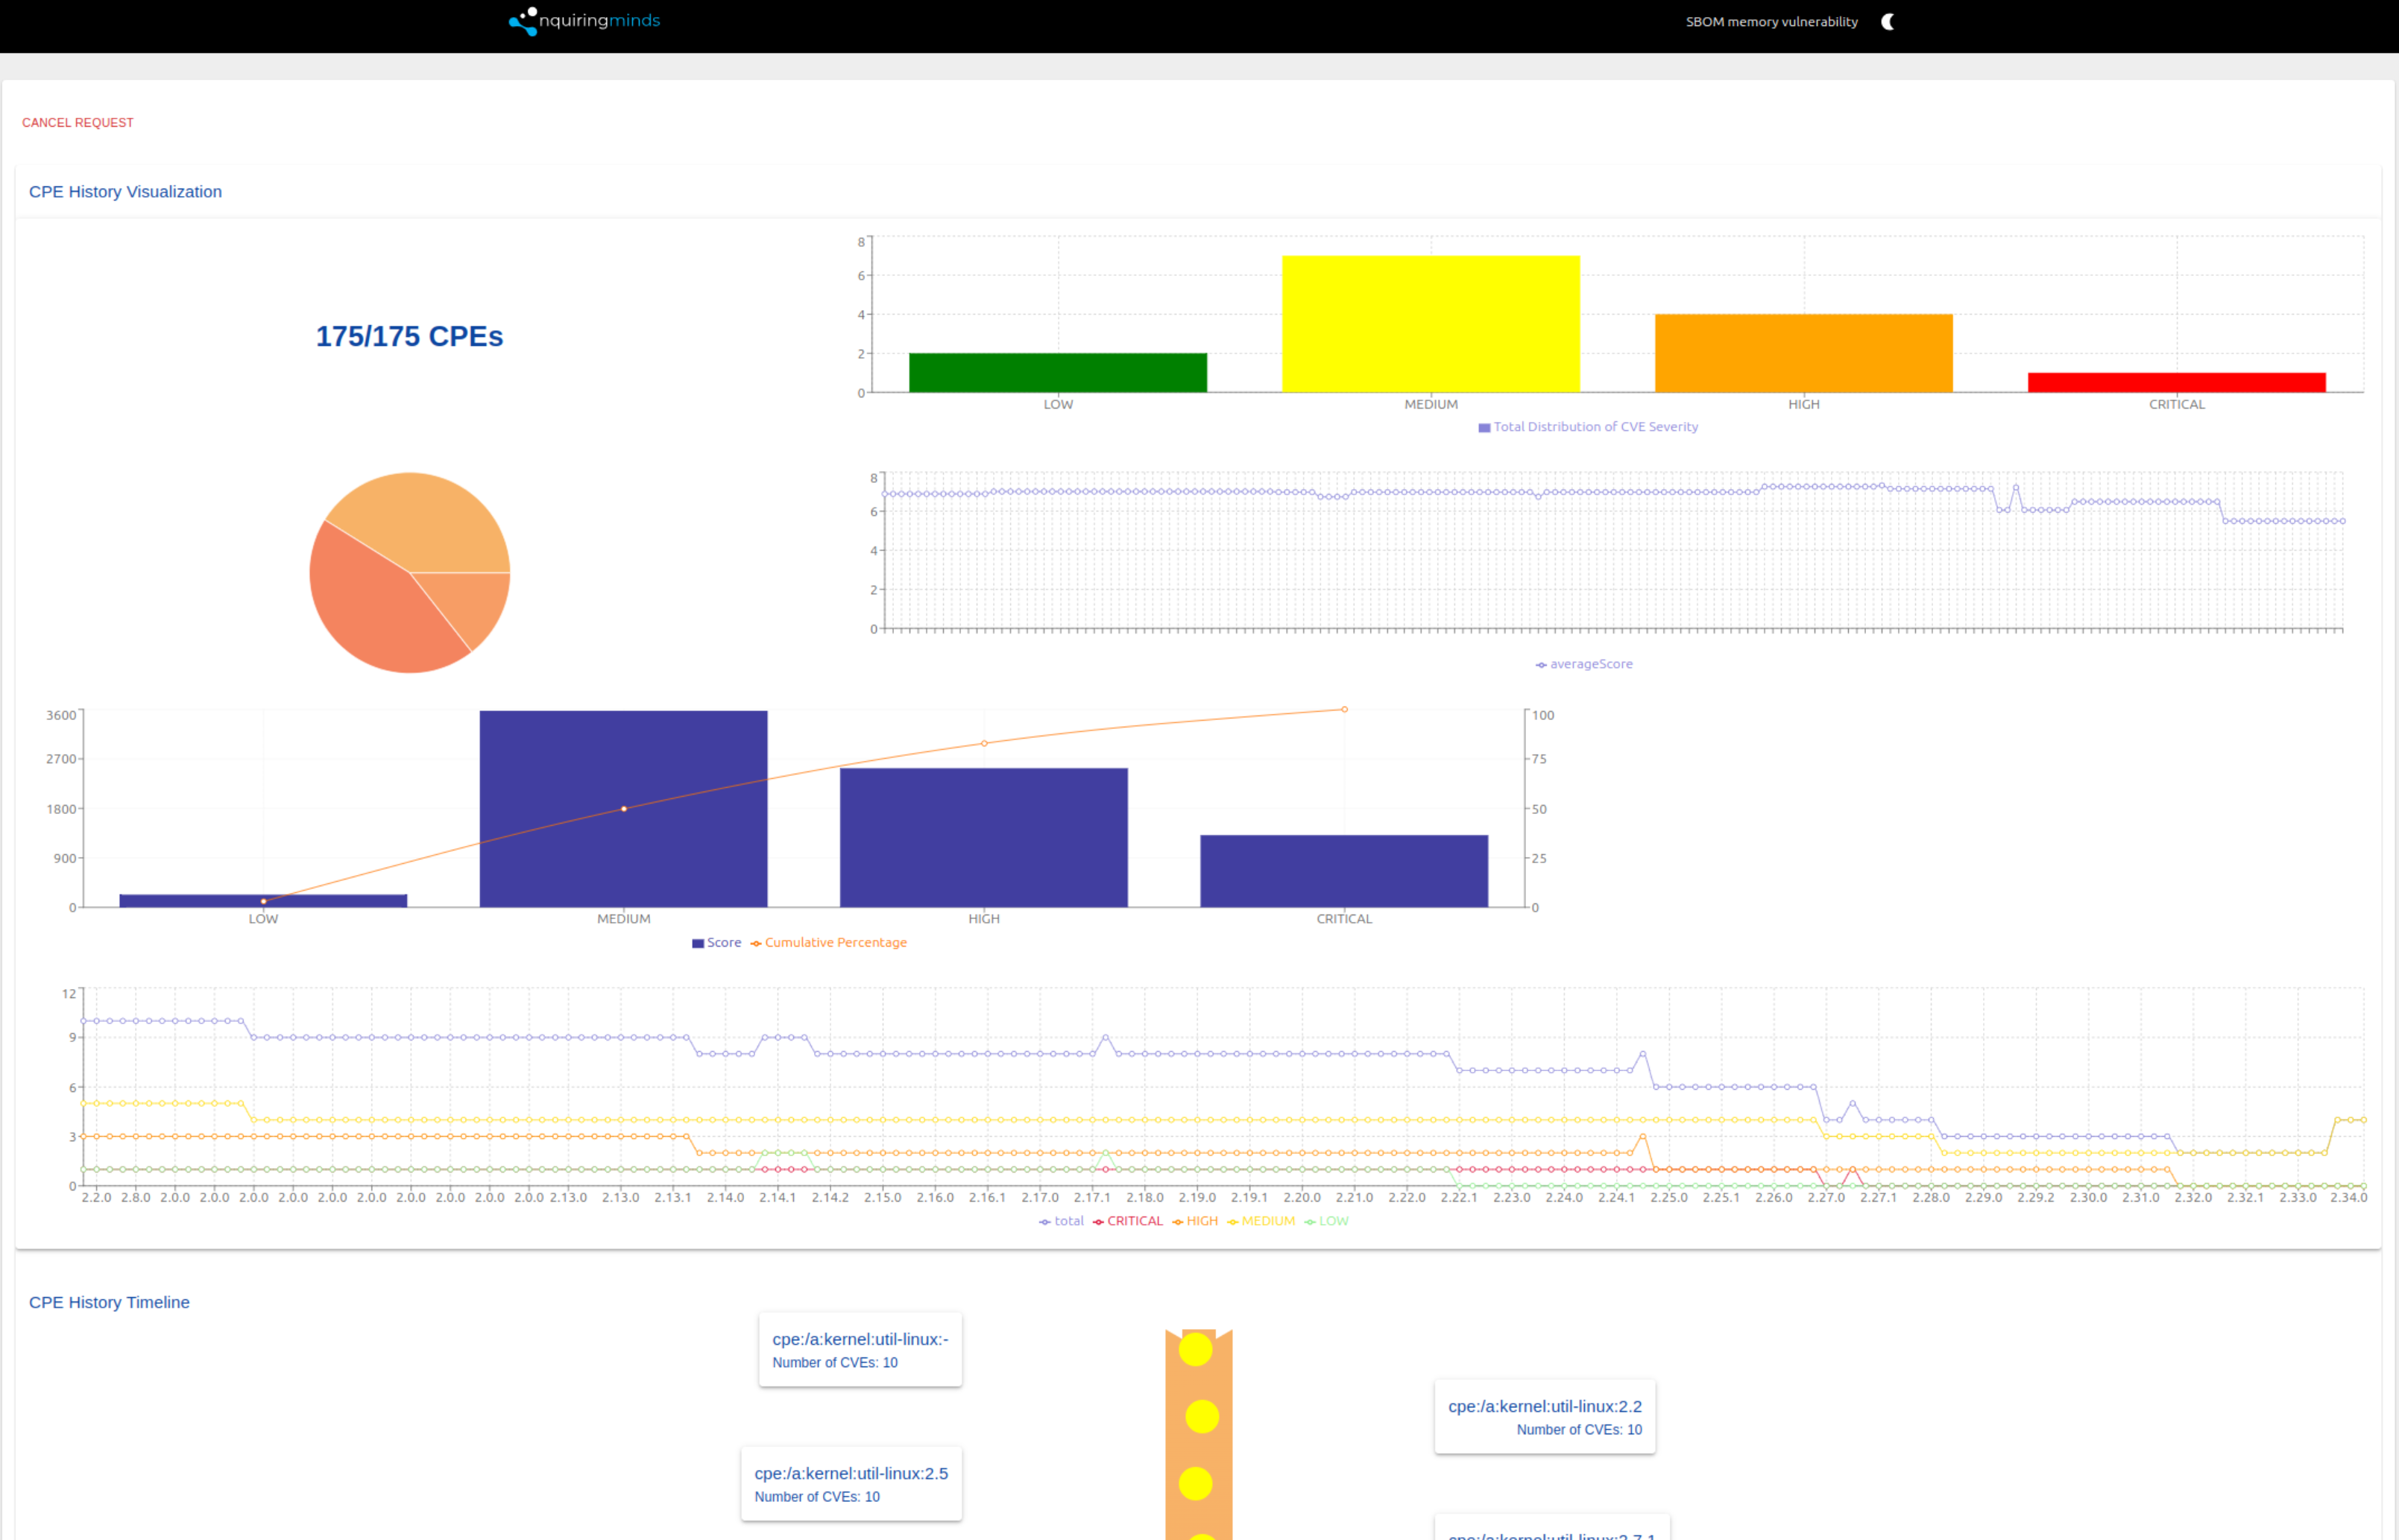
Evolutionary CPE Tracking:
Track the historical evolution of a Common Platform Enumeration (CPE) through a timeline that reflects the changes in vulnerability scores over different versions, providing insights into how the security posture has evolved.
Interactive Graphs:
The interactive graphs display the average vulnerability score across different versions of a CPE, highlighting the progression and providing a visual representation of potential security improvements or regressions.
Vulnerability Type Breakdown:
The pie chart offers a breakdown of vulnerabilities by type, such as those related to memory safety, allowing for focused attention on specific vulnerability categories that may impact the risk assessment and mitigation strategies.
CPE Specific Visualisation:
The CPE History Visualization page offers a unique visual representation for a selected CPE, detailing the number of CVEs associated with each version, aiding in identifying patterns or spikes in vulnerabilities that warrant further investigation.
Pareto Chart:
The Pareto chart provides insights into the cumulative impact of different severity levels across various CVEs, aiding in understanding the distribution of severity scores and identifying the most impactful vulnerabilities.
Time Series Chart:
The time series chart offers a temporal view of the security posture changes over different versions of a CPE, tracking the evolution of vulnerabilities across different severities, helping to identify trends and improvements over time.